
To transform data in a Power BI dashboard, it is useful to add columns. This can be done both in Power Query and in the report view. This allows data to be combined or added. In this knowledge base article, we will explain step by step how to add a column in Power BI.
1: Creating a new column in Power Query
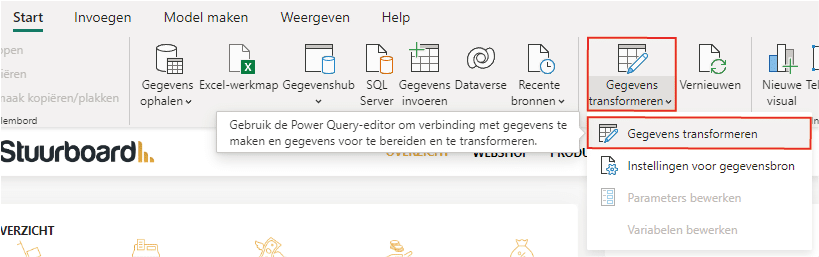
To add a column in Power Query, you need to have a report open in Power BI Desktop. Select ‘Home’ and then twice ‘Transform Data’. This opens the Power Query editor.
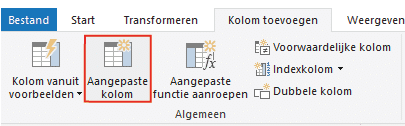
Then select the query in which you want to place a column. Add a new column via ‘Add Column’ and ‘Custom Column’.
A new screen opens where Power Query formulas can be placed. This allows not only various calculations but also simply adding text.
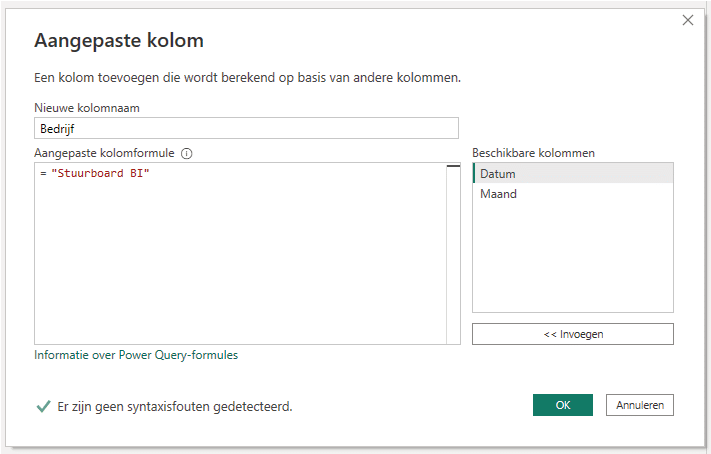
Adding a column is not only possible by writing a formula yourself but also by adding, for example, an index or conditional column.
2: Adding a new column in the report view of Power BI
By adding a new column in the report view, you add a column to a table already included in the model. In this case, a DAX formula is used to define the values of the column. This is also only possible in Power BI Desktop. This allows data from different columns or tables to be combined, added, or transformed. Adding a new column is possible by going to the table view, selecting the ‘Table Tools’ tab, and clicking ‘New Column’.
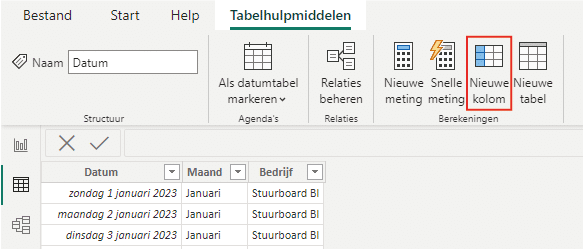
This adds a new column where you then need to enter a DAX formula. Depending on the purpose of the column, endless formulas are available. If you use Excel, the DAX formulas will be familiar to you.

This is how you can add a column in Power BI. Also, check out the other articles in our knowledge base. For example, if you want to display the time of the last refresh in your dashboard, read here how to achieve this step by step. If you have questions, feel free to contact us.