
Power BI offers the ability to add a tooltip value to a visual. This means that when you hover over a visual, you will see a value associated with that visual. This is also called tooltip info. However, sometimes you may want to show more information than just a single value. And you can! With the custom tooltips feature in Power BI, you can display an endless amount of data on hover. In the video below, you can see how we apply this to a sales dashboard to show the desired information for one province without taking up space on the dashboard. In this article, we will show you how.
1. Creating a custom tooltip in Power BI
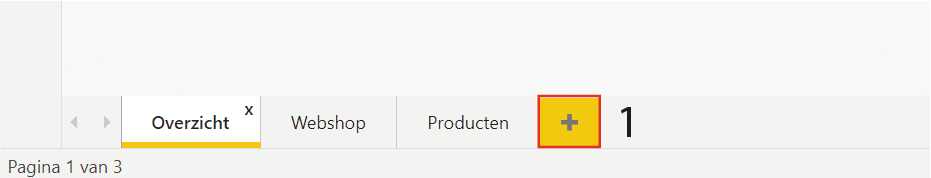
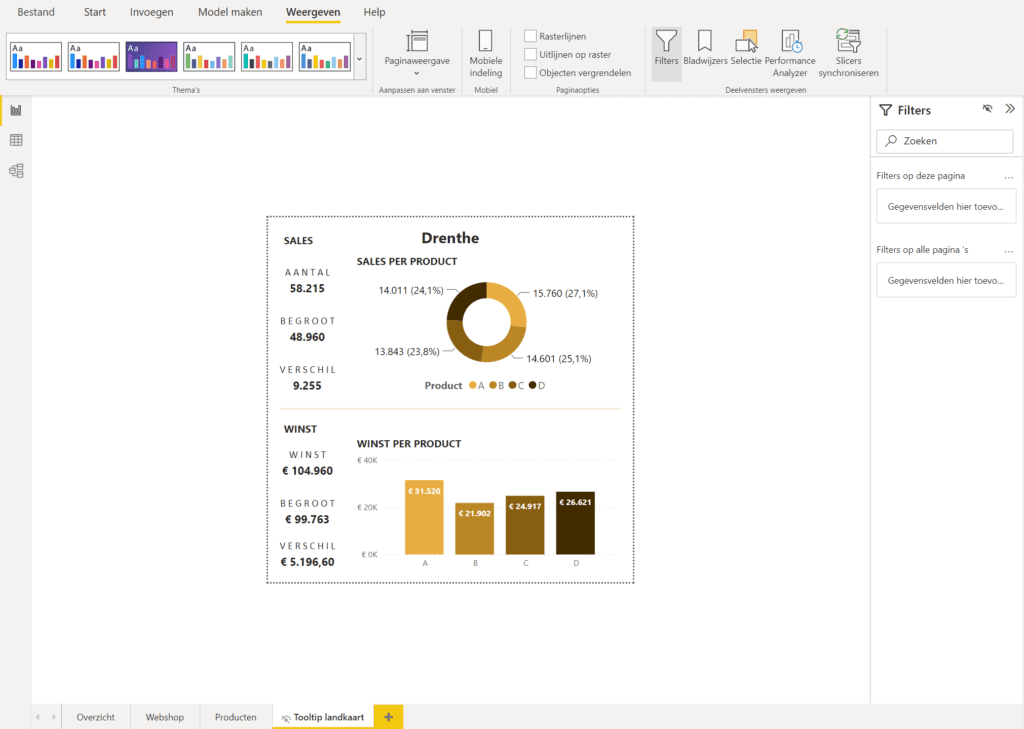
First of all, it is important that we have a working dashboard where we can create the custom tooltip. In this example, we use the sales dashboard. To create the tooltip, we first add a new page in our existing dashboard by clicking the plus sign at the bottom left.
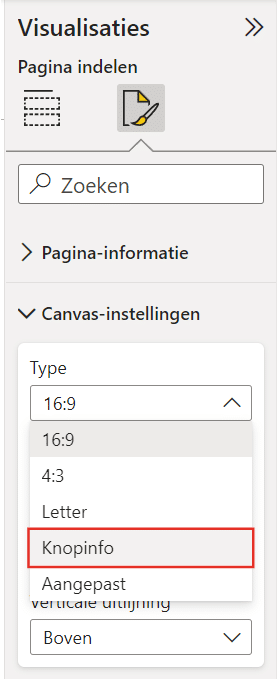
A new page will now be created within the dashboard. This will eventually be the template that will function as the tooltip, so we need to make this clear in Power BI. To do this, click on the right side in the ‘Visualizations pane’ on ‘Canvas settings’ > ‘Tooltip’.
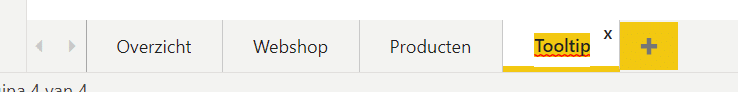
By double-clicking the new page at the bottom left of the screen (it will probably be called ‘Page 1’), you can rename the page.
You can now create a visualization on this page that you ultimately want to see as a tooltip. It is of course important that this visual contains information that corresponds to the visualization to which you will add the tooltip. If this is not the case, there will be little to see. In our case, we will eventually add the tooltip to a map. So we use data about sales per province to display extra information.
2. Add tooltip to visual
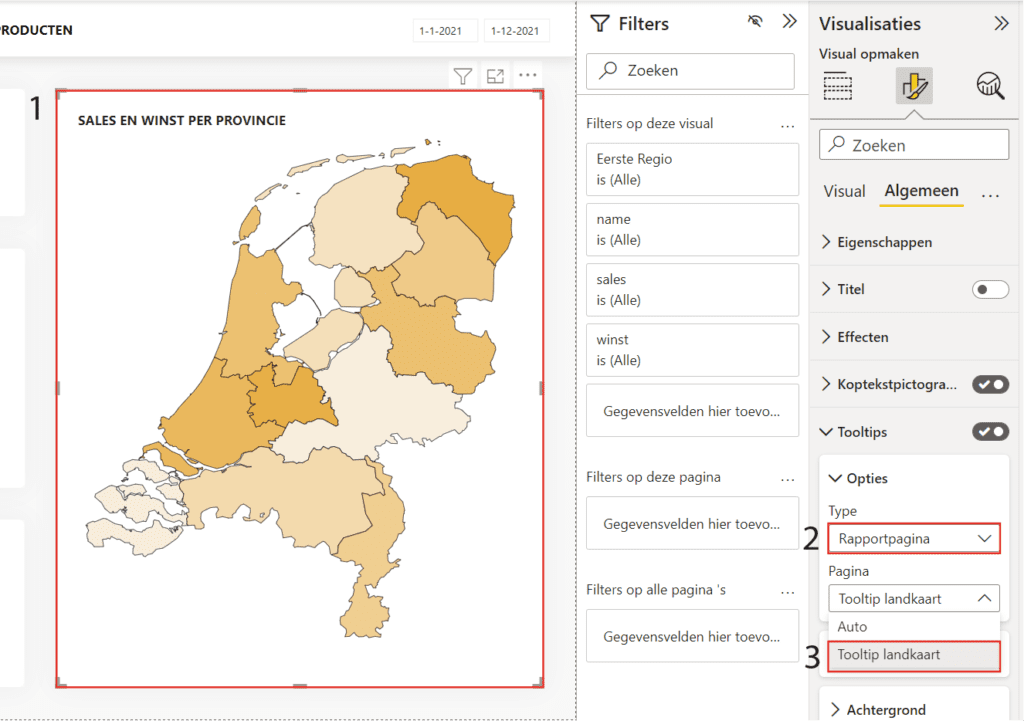
Now that the tooltip is created, we can add it to the visual. To do this, go back to the screen with the visualization where you want to add the tooltip. Select the desired visual and go to ‘Format visualizations’ > ‘Tooltips’ and select under ‘Type’ > ‘Report page’ and under ‘Page’ > the page you created in the previous step.
After following this article, you can show custom tooltips in Power BI when you hover over the visual with your mouse! This way, you can display more information without sacrificing space in your report. Also, check out the other articles in our knowledge base. Do you have questions? Feel free to contact us.