
Have you ever dealt with a column of data that you actually want to group? You don’t need to create a separate column for this, as this feature is already built into Power BI. This makes it possible to group data into categories in Power BI. For example, if you want to group multiple names into one category, this article from our knowledge base explains step by step how to achieve this.
Step 1: Grouping Data in Power BI
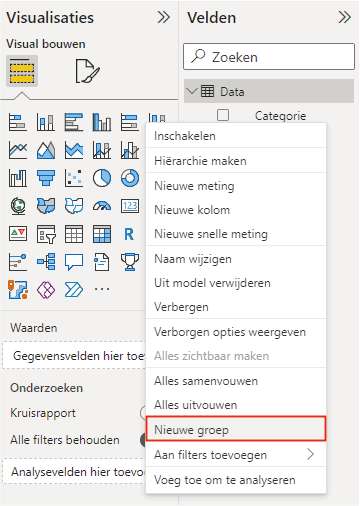
Creating a group is simple. Go to ‘Fields’ and right-click on the field you want to group. Then click on ‘New group’, as shown in the image below.
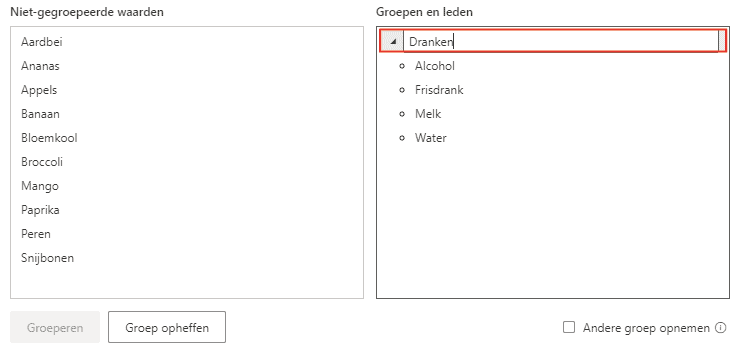
The screen that opens allows you to create groups based on the values in the column. In this example, the values are grouped into drinks, vegetables, and fruit. Select one or more values (using CTRL) in the left box and click ‘Group’. This creates a group, which you can rename by double-clicking the title. You can repeat this step for the other ungrouped values.
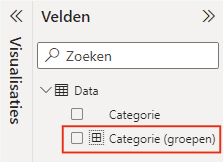
Once the groups are created, you can confirm this, after which a new field is created, as shown in the image below. You can recognize the field by the icon in front of the field name.
Step 2: Using Grouped Data
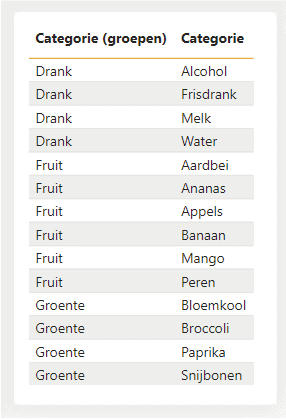
Using the created group is simple. It works like any other field. The image below shows a table with the added groups. This shows how easy it is to turn individual data into structured groups.
Hopefully, you have also succeeded in grouping data in Power BI. We have other articles in our knowledge base as well. For example, are you curious about how bookmarks work within Power BI? Then read here the article about bookmarks, so you can apply that in a dashboard. Do you have questions? Then contact us.